KY Export Facts

FACTS AND FIGURES

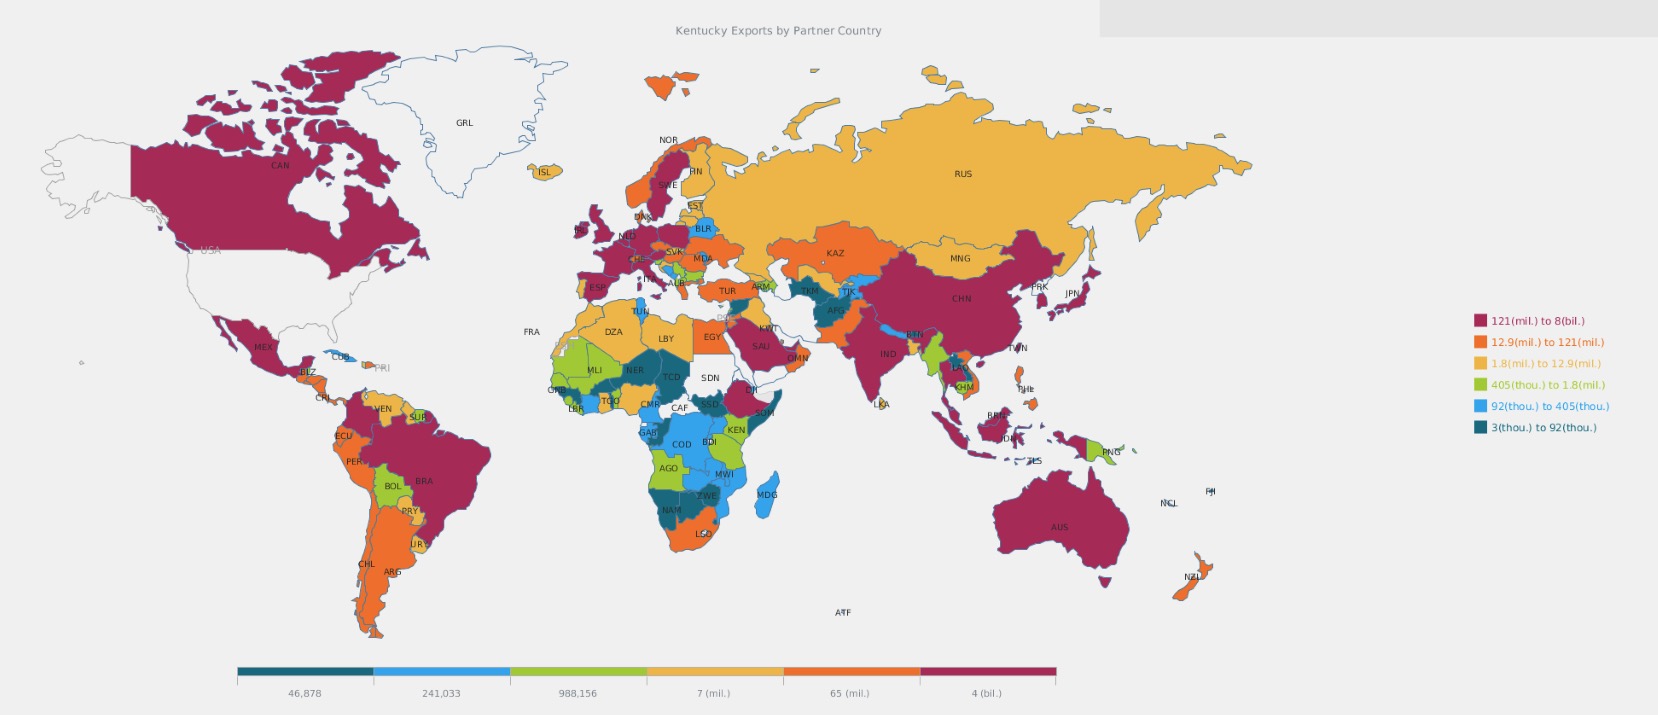
Exports help grow and strengthen Kentucky’s economy. Selling to other countries helps companies ride out seasonal and regional fluctuations in sales, extend the lifecycles of their products, develop and adapt new products and diversify their dependence on sectors and clients.

Exports Year To Year

KENTUCKY'S TOTAL EXPORTS: 2015 TO 2025

Year Exports (USD)
202550,629,895,139
202447,922,178,331
202340,247,256,756
202234,923,760,653
202129,802,158,271
202024,618,073,807
201933,007,256,587
201831,807,608,747
201730,918,815,628
201629,192,167,886
201527,636,602,594

KENTUCKY'S TOP INDUSTRY EXPORTS FOR 2025

NAICS Description Exports (USD)
TOTAL ALL INDUSTRIES50,629,895,139
3364Aerospace Products And Parts23,471,588,004
3254Pharmaceuticals And Medicines4,087,002,881
3361Motor Vehicles3,338,982,346
3363Motor Vehicle Parts2,166,766,527
3341Computer Equipment1,557,821,274
3336Engines, Turbines, And Power Transmission Equipment1,258,049,142
3329Other Fabricated Metal Products1,126,961,548
3252Resin, Synthetic Rubber, Fibers & Filament1,052,991,054
3345Navigational, Measuring, Electromedical, And Control Instruments901,682,562
3342Communications Equipment828,363,493

Exports By Country

KENTUCKY'S TOP 10 EXPORT COUNTRIES IN 2025

Country Exports (USD)
Canada8,368,817,935
United Kingdom5,398,948,479
France5,307,798,800
China4,704,711,668
Mexico3,963,848,179
Brazil3,929,730,065
Malaysia2,470,036,557
Singapore2,238,628,844
Netherlands1,903,929,978
Austria1,383,934,680

KENTUCKY'S 2025 EXPORTS TO CANADA: TOP 10 INDUSTRY BY SECTOR

NAICS Description Exports (USD) % 2024-2025
TOTAL ALL INDUSTRIES8,368,817,935-12.25
3361Motor Vehicles2,420,771,558-22.95
3363Motor Vehicle Parts1,192,021,8015.79
3364Aerospace Products And Parts781,332,54441.8
3341Computer Equipment341,069,198-1.71
3261Plastics Products253,089,803-0.52
3311Iron And Steel And Ferroalloy186,890,047-27.36
3252Resin, Synthetic Rubber & Artificial Fibers181,646,377-16.75
3339Other General Purpose Machinery170,001,7513.54
3335Metalworking Machinery162,683,287-31.31
3399Miscellaneous Manufactured Commodities152,287,203-24.9

KENTUCKY'S 2025 EXPORTS TO UNITED KINGDOM: TOP 10 INDUSTRY BY SECTOR

NAICS Description Exports (USD) %2024-2025
TOTAL ALL INDUSTRIES 5,398,948,479 9.51
3364 Aerospace Products And Parts 3,970,278,582 9.09
3254 Pharmaceuticals And Medicines 739,233,840 74.91
3336 Engines, Turbines, And Power Transmission Equipment 116,387,455 -33.87
3329 Other Fabricated Metal Products 112,332,578 8.18
3219 Other Wood Products 95,513,395 -30.91
3121 Beverages 30,571,827 11.33
3359 Electrical Equipment And Components, Nesoi 30,066,922 12.77
3363 Motor Vehicle Parts 29,566,932 1.68
3399 Miscellaneous Manufactured Commodities 21,510,248 -59.99
3261 Plastics Products 18,191,778 23.79

KENTUCKY'S 2025 EXPORTS TO FRANCE: TOP 10 INDUSTRY BY SECTOR

NAICS Description Exports (USD) %2024-2025
TOTAL ALL INDUSTRIES 5,307,798,800 11.71
3364 Aerospace Products And Parts 4,410,311,233 17.82
3329 Other Fabricated Metal Products 179,428,133 55.16
3336 Engines, Turbines, And Power Transmission Equipment 174,502,433 -52.06
3345 Navigational, Measuring, Electromedical, And Control Instruments 128,993,721 227.2
3254 Pharmaceuticals And Medicines 113,186,279 -6.77
3363 Motor Vehicle Parts 58,245,243 101.52
3252 Resin, Synthetic Rubber, & Artificial & Synthetic Fibers & Filiment 46,250,693 -30.42
3325 Hardware 39,631,942 83.12
3339 Other General Purpose Machinery 19,830,311 92.52
3327 Bolts, Nuts, Screws, Rivets, Washers And Other Turned Products 17,769,512 31.53

KENTUCKY'S 2025 EXPORTS TO CHINA: TOP 10 INDUSTRY BY SECTOR

NAICS Description Exports (USD) %2024-2025
TOTAL ALL INDUSTRIES 4,704,711,668 9.02
3364 Aerospace Products And Parts 3,255,335,410 24.38
3336 Engines, Turbines, And Power Transmission Equipment 217,919,387 -30.29
3329 Other Fabricated Metal Products 157,838,388 24.78
3272 Glass And Glass Products 142,978,354 -10.82
3252 Resin, Synthetic Rubber, & Artificial & Synthetic Fibers & Filiment 109,553,249 -16.15
3111 Animal Foods 100,707,159 -12.29
3363 Motor Vehicle Parts 69,873,506 60.31
3254 Pharmaceuticals And Medicines 68,531,399 -42.91
3261 Plastics Products 49,280,203 17.68
3251 Basic Chemicals 49,057,554 -12.22
3259 Other Chemical Products And Preparations 46,191,571 -18.36

KENTUCKY'S 2025 EXPORTS TO MEXICO: TOP 10 INDUSTRY BY SECTOR

NAICS Description Exports (USD) %2024-2025
TOTAL ALL INDUSTRIES 3,963,848,179 -4.52
3364 Aerospace Products And Parts 752,281,142 56.82
3361 Motor Vehicles 522,512,724 -31.44
3363 Motor Vehicle Parts 475,955,219 0.53
3313 Alumina And Aluminum And Processing 247,592,192 -7.33
3261 Plastics Products 178,078,884 15.9
3311 Iron And Steel And Ferroalloy 152,060,178 -0.89
3252 Resin, Synthetic Rubber, & Artificial & Synthetic Fibers & Filiment 146,939,444 -7.59
3359 Electrical Equipment And Components, Nesoi 116,689,399 0.83
3329 Other Fabricated Metal Products 116,317,290 -6.92
3335 Metalworking Machinery 83,065,851 -19.54

KENTUCKY'S 2025 EXPORTS TO BRAZIL: TOP 10 INDUSTRY BY SECTOR

NAICS Description Exports (USD) %2024-2025
TOTAL ALL INDUSTRIES 3,929,730,065 5.87
3364 Aerospace Products And Parts 2,916,373,128 7.4
3341 Computer Equipment 203,085,183 1,179.94
3336 Engines, Turbines, And Power Transmission Equipment 198,735,068 -42.09
3329 Other Fabricated Metal Products 96,839,856 1.42
3252 Resin, Synthetic Rubber, & Artificial & Synthetic Fibers & Filiment 72,107,029 25.06
2121 Coal And Petroleum Gases 57,445,379 -6.37
3251 Basic Chemicals 46,183,310 0.13
3363 Motor Vehicle Parts 43,388,132 116.5
3254 Pharmaceuticals And Medicines 42,813,286 -19.71

KENTUCKY'S 2025 EXPORTS TO MALAYSIA: TOP 10 INDUSTRY BY SECTOR

NAICS Description Exports (USD) %2024-2025
TOTAL ALL INDUSTRIES 2,470,036,557 44.81
3364 Aerospace Products And Parts 2,162,654,465 54.45
3336 Engines, Turbines, And Power Transmission Equipment 119,054,434 -16.16
3329 Other Fabricated Metal Products 66,583,243 75.48
3363 Motor Vehicle Parts 23,623,321 213.14
3325 Hardware 14,544,390 367.13
3359 Electrical Equipment And Components, Nesoi 14,429,770 119.35
3399 Miscellaneous Manufactured Commodities 9,482,256 -66.89
3254 Pharmaceuticals And Medicines 7,175,872 43.97
3252 Resin, Synthetic Rubber, & Artificial & Synthetic Fibers & Filiment 6,215,967 -7.78
3327 Bolts, Nuts, Screws, Rivets, Washers And Other Turned Products 5,879,041 14.6

KENTUCKY'S 2025 EXPORTS TO SINGAPORE: TOP 10 INDUSTRY BY SECTOR

NAICS Description Exports (USD) %2024-2025
TOTAL ALL INDUSTRIES 2,238,628,844 58.77
3364 Aerospace Products And Parts 1,614,981,426 56.96
3341 Computer Equipment 265,275,294 319.69
3329 Other Fabricated Metal Products 55,294,831 26.35
3336 Engines, Turbines, And Power Transmission Equipment 49,132,783 -9.64
3346 Magnetic And Optical Media 30,971,147 194.17
3345 Navigational, Measuring, Electromedical, And Control Instruments 23,843,219 82.6
3344 Semiconductors And Other Electronic Components 20,313,019 119.24
3251 Basic Chemicals 19,112,934 -5.36
3391 Medical Equipment And Supplies 17,367,696 7.65
3363 Motor Vehicle Parts 17,049,769 -2.4

KENTUCKY'S 2025 EXPORTS TO NETHERLANDS: TOP 10 INDUSTRY BY SECTOR

NAICS Description Exports (USD) %2024-2025
TOTAL ALL INDUSTRIES 1,903,929,978 10.38
3345 Navigational, Measuring, Electromedical, And Control Instruments 374,262,895 14.94
3254 Pharmaceuticals And Medicines 357,493,749 14.64
3364 Aerospace Products And Parts 330,329,636 -4.7
3121 Beverages 264,373,340 69.93
3252 Resin, Synthetic Rubber, & Artificial & Synthetic Fibers & Filiment 118,021,568 48.27
3391 Medical Equipment And Supplies 71,318,858 -16.2
3341 Computer Equipment 64,249,242 93.52
2121 Coal And Petroleum Gases 59,307,093 10.11
3335 Metalworking Machinery 58,749,331 -15.39
3342 Communications Equipment 50,594,498 54.9

KENTUCKY'S 2025 EXPORTS TO AUSTRIA: TOP 10 INDUSTRY BY SECTOR

NAICS Description Exports (USD) %2024-2025
TOTAL ALL INDUSTRIES 1,383,934,680 11.85
3254 Pharmaceuticals And Medicines 1,342,115,771 13.99
3364 Aerospace Products And Parts 11,722,976 -61.38
3336 Engines, Turbines, And Power Transmission Equipment 10,478,015 -6.92
3311 Iron And Steel And Ferroalloy 10,205,082 0.85
3314 Nonferrous Metal (Except Aluminum) And Processing 4,530,750 296.5
3391 Medical Equipment And Supplies 1,256,758 15.21
3329 Other Fabricated Metal Products 472,891 -54.77
3279 Other Nonmetallic Mineral Products 350,389 Infinity
3345 Navigational, Measuring, Electromedical, And Control Instruments 307,822 25.52
3399 Miscellaneous Manufactured Commodities 290,872 -2.84

EXPORTS BY REGION

KENTUCKY'S 2025 EXPORTS TO EUROPE (INCLUDING TURKEY): TOP 10 INDUSTRY BY SECTOR

NAICS Description Exports (USD) %2024-2025
TOTAL ALL INDUSTRIES 17,875,208,092 9.59
3364 Aerospace Products And Parts 9,877,471,299 12.33
3254 Pharmaceuticals And Medicines 3,227,841,278 21.81
3345 Navigational, Measuring, Electromedical, And Control Instruments 540,290,903 30.39
3121 Beverages 532,128,565 24.16
3336 Engines, Turbines, And Power Transmission Equipment 395,236,645 -40.49
3329 Other Fabricated Metal Products 391,604,998 22.04
3252 Resin, Synthetic Rubber, & Artificial & Synthetic Fibers & Filiment 358,698,237 -9.12
2121 Coal And Petroleum Gases 242,171,723 -1.48
3341 Computer Equipment 239,636,445 24.43
3251 Basic Chemicals 207,227,063 10.2

KENTUCKY'S 2025 EXPORTS TO ASIAN CONTINENT (EXCLUDING MIDDLE EAST & TURKEY): TOP 10 INDUSTRY BY SECTOR

NAICS Description Exports (USD) %2024-2025
TOTAL ALL INDUSTRIES 13,282,028,253 19.64
3364 Aerospace Products And Parts 7,967,438,248 42
3341 Computer Equipment 586,292,933 7.29
3336 Engines, Turbines, And Power Transmission Equipment 539,312,818 -12.99
3342 Communications Equipment 493,179,433 3.57
3254 Pharmaceuticals And Medicines 420,587,938 -17.25
3329 Other Fabricated Metal Products 383,458,152 43.86
3252 Resin, Synthetic Rubber, & Artificial & Synthetic Fibers & Filiment 261,866,491 -14.32
3251 Basic Chemicals 226,823,382 21.74
3363 Motor Vehicle Parts 166,540,693 10.35
3272 Glass And Glass Products 146,042,032 -12.91

KENTUCKY'S 2025 EXPORTS TO CENTRAL AND SOUTH AMERICA: TOP 10 INDUSTRY BY SECTOR

NAICS Description Exports (USD) %2024-2025
TOTAL ALL INDUSTRIES 4,543,753,861 4.07
3364 Aerospace Products And Parts 2,928,918,246 7.38
3341 Computer Equipment 245,313,342 988.16
3336 Engines, Turbines, And Power Transmission Equipment 201,976,428 -41.63
3254 Pharmaceuticals And Medicines 108,521,163 -8.96
3329 Other Fabricated Metal Products 101,823,038 1.53
3252 Resin, Synthetic Rubber, & Artificial & Synthetic Fibers & Filiment 92,367,285 19.67
3363 Motor Vehicle Parts 83,880,997 126.32
3361 Motor Vehicles 72,684,922 -19.86
3251 Basic Chemicals 71,137,557 10.09
3359 Electrical Equipment And Components, Nesoi 63,166,101 46.24

KENTUCKY'S 2025 EXPORTS TO ASIA MIDDLE EAST (EXCLUDING TURKEY): TOP 10 INDUSTRY BY SECTOR

NAICS Description Exports (USD) %2024-2025
TOTAL ALL INDUSTRIES 1,812,347,828 23.59
3364 Aerospace Products And Parts 1,013,607,347 54.23
3361 Motor Vehicles 216,628,458 -9.62
3254 Pharmaceuticals And Medicines 118,622,949 -2.94
3342 Communications Equipment 72,055,377 0.48
3251 Basic Chemicals 55,938,553 -54.11
3256 Soaps, Cleaning Compounds, And Toilet Preparations 34,436,951 625.6
3329 Other Fabricated Metal Products 28,210,978 35.08
3336 Engines, Turbines, And Power Transmission Equipment 26,819,331 23.65
3363 Motor Vehicle Parts 26,036,297 16.7
3359 Electrical Equipment And Components, Nesoi 20,883,817 174.66

KENTUCKY'S 2025 EXPORTS TO AFRICAN CONTINENT: TOP 10 INDUSTRY BY SECTOR

NAICS Description Exports (USD) %2024-2025
TOTAL ALL INDUSTRIES 230,972,796 -5.05
3364 Aerospace Products And Parts 135,014,011 32.06
3363 Motor Vehicle Parts 10,241,116 -56.48
3254 Pharmaceuticals And Medicines 8,271,795 -21.41
3251 Basic Chemicals 8,262,318 -28.26
3336 Engines, Turbines, And Power Transmission Equipment 5,907,860 14.47
3259 Other Chemical Products And Preparations 5,831,759 152
3342 Communications Equipment 5,388,467 -13.31
9300 Used Or Second-Hand Merchandise 4,830,650 80.59
3339 Other General Purpose Machinery 3,760,819 28.86
3121 Beverages 3,017,339 38.88

JOBS SUPPORTED BY EXPORTS

JOBS SUPPORTED BY KENTUCKY EXPORTS 2024 TO ALL COUNTRIES

NAICS Description Number of Jobs %2023-2024
TOTAL ALL INDUSTRIES 355,845 14.43
3364 Aerospace Product And Parts Manufacturing 97,999 41.53
3361 Motor Vehicle Manufacturing 27,510 14.56
3254 Pharmaceutical And Medicine Manufacturing 20,739 -5.55
3363 Motor Vehicle Parts Manufacturing 18,136 -1.25
3251, 3252, 3253, 3259 Chemical Manufacturing (3251,2,3,9) 12,996 -13.67
3336 Engine, Turbine, And Power Transmission Equipment Manufacturing 12,377 87.94
492 Couriers And Messengers 9,602 3.87
3321, 3322, 3325, 3326, 3329 Fabricated Metal Product Manufacturing (3321,2,5,6,9) 9,284 13.14
521, 522 Monetary Authorities - Central Bank, And Credit Intermediation And Related Activities 9,234 18.11
722 Food Services And Drinking Places 7,560 16.02

KENTUCKY EXPORTS OF ALL SERVICES TO ALL COUNTRIES

Kentucky Cummulative Annual Rate of Growth 2012-2024 6.05% U.S. Cummulative Annual Rate of Growth 2012-2024 4.40%

All form fields are required. / Todos los campos son requeridos